How To Setup a Free PHP Debugger using Eclipse PDT + XDebug
When I debug code, I find that a debugger is a very powerful tool. With a debugger you can set breakpoints, step through code, watch variables, do a stack trace, and much, much more. The eclipse PDT + XDebug offers a PHP debugger that you can use for free. It also offers a full PDT IDE (for editing, “building”, and debugging your PHP projects), but I use eclipse+PDT+XDebug only as a debugger since I like to use my favorite editor for editing. This guide shows how to setup eclipse+PDT+XDebug as your PHP Debugger.
This guide was written and tested using the R20080603 – 1.0.3 PDT all in one package. I also used XDebug 2.0.3. With versions other than PDT R20080603 and XDebug 2.0.3, there may be subtle differences from what I wrote here, or things may not work.
- Make sure you have the latest version of Java installed.
- Make sure you have Apache+PHP installed (such as using the XAMPP package)
- Download XDebug
- Go to the XDebug page
- On right side of page, click on one of the Windows modules that matches your PHP version
- Download the .dll file and remember its file name the directory that you saved it in (I save it in “c:\xampp\php\ext”).
- Install XDebug
- Open your php.ini file in a text editor
- In XAMPP, the default location for the php.ini file is “c:\xampp\apache\bin\php.ini”
- If not using XAMPP, you can find the location of php.ini by browsing to a .php file on your server that calls the phpinfo() function.
- Either uncomment (recent versions of XAMPP have this in php.ini, but commented) or add:
- Note: substitute the right path/filename for your xdebug dll file
[XDebug]
;; Only Zend OR (!) XDebug
; zend_extension_ts="C:\xampp\php\ext\php_xdebug.dll"
; Modify the filename below to reflect the .dll version of your xdebug
zend_extension_ts="C:\xampp\php\ext\php_xdebug-2.0.3-5.2.5.dll"
xdebug.remote_enable=true
xdebug.remote_host=127.0.0.1  ; if debugging on remote server,
                              ; put client IP here
xdebug.remote_port=9000
xdebug.remote_handler=dbgp
xdebug.profiler_enable=0
xdebug.profiler_output_dir="C:\xampp\tmp"
Note that “xdebug.profiler_enable” is set to 0 above instead of 1. This is not the default in the XAMPP php.ini, and I recommend changing it to 0. It was suggested to me to set this to 0 in order to not generate very large files.
- Comment out any Zend Optimizer in php.ini because it is not compatible with XDebug. For example, all of this should be commented out (using “;”):
[Zend]
; zend_extension_ts = "C:\xampp\php\zendOptimizer\lib\ZendExtensionManager.dll"
; zend_extension_manager.optimizer_ts = "C:\xampp\php\zendOptimizer\lib\Optimizer"
; zend_optimizer.enable_loader = 0
; zend_optimizer.optimization_level=15
;zend_optimizer.license_path =
- Restart your webserver for the php.ini to take effect.
- Test that the Xdebug install was successful
- Create a .php file that calls “phpinfo()”
- Open the .php file with “phpinfo()” in your browser
- Check for XDebug in the phpinfo page.
- Open your php.ini file in a text editor
- Download Eclipse PDT
- Go to the Eclipse PDT Download page
- On the download page, click the link for the latest release build in the “Build Name” column.
- On the release build page, select the windows ZIP file in the “PDT All in One Package” area
- On the mirror selection page, choose a mirror to download from and download the .zip file.
- Install Eclipse PDT all-in-one
- There is no install .exe file to run.
- Unzip the all-in-one zip file to a temporary directory.
- Move the “eclipse” directory (created during unzip) to c:\eclipse (I tried using “c:\Program Files\eclipse” instead of c:\eclipse, but it didn’t seem to work for me, so use c:\eclipse).
- Execute Eclipse for the first time + Setup XDebug
- Execute the c:\eclipse\eclipse.exe file.
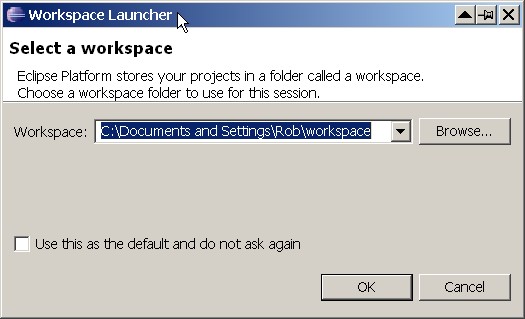
- “Workspace Launcher” dialog box will appear, I just keep the default and press “OK”
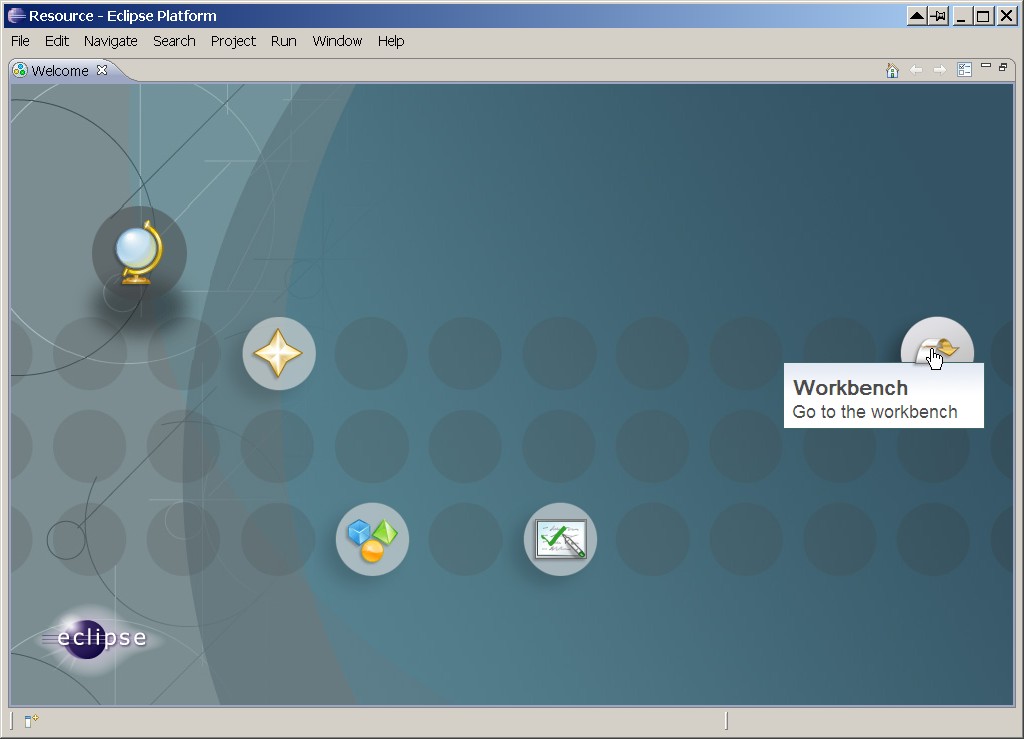
- “Welcome” screen, click on “Workbench” icon on right side towards the middle.
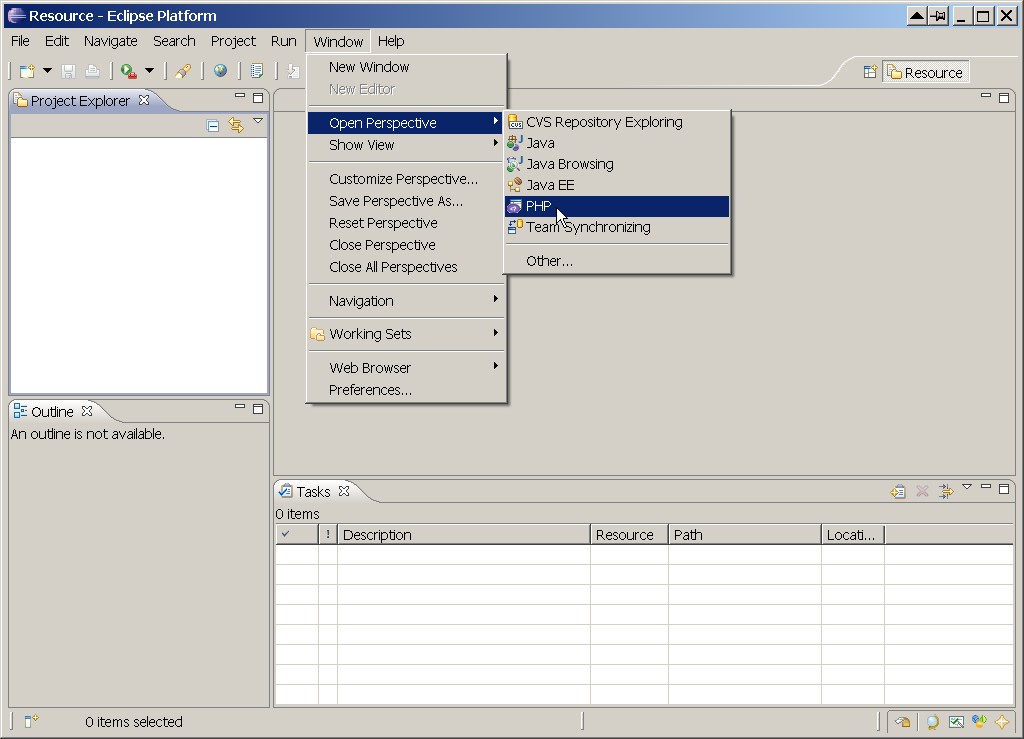
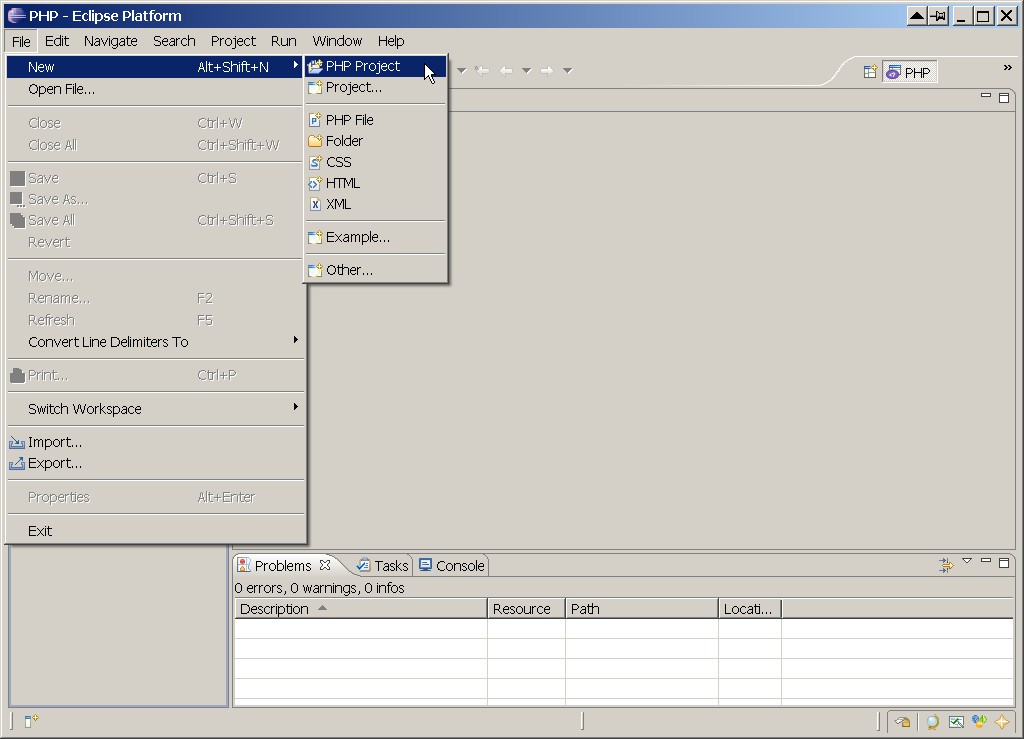
- Eclipse Workbench, do: “Window->Open Perspective->PHP”
- File->New->PHP Project
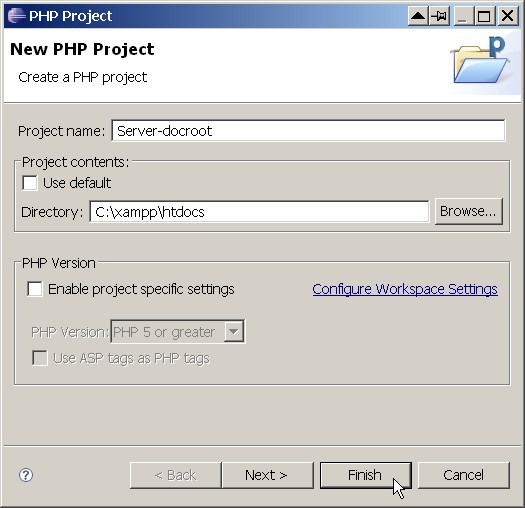
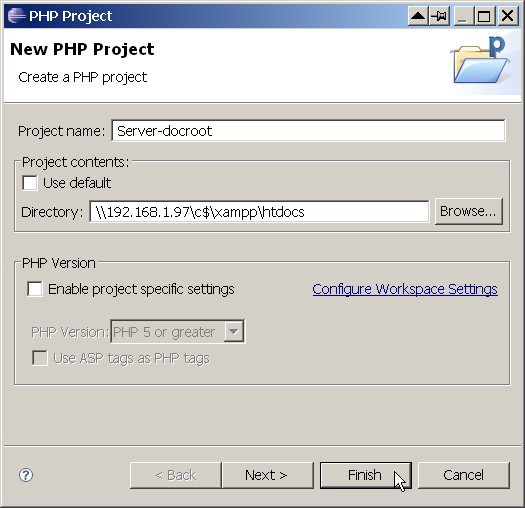
- Project Name: assign a name such as “Server-docroot”
- Project Contents: uncheck “Default”, and browse to the document root of your web server. (remote server example)
- Click “Finish”
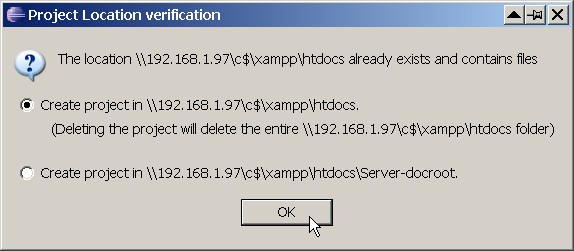
- You’ll now see a screen that gives you 2 options, choose the 1st option “Create project in directoryName (Deleting the project will delete the entire directoryName folder)”, and click “OK”.
- Don’t ever delete this project from eclipse or it will delete your entire docroot.
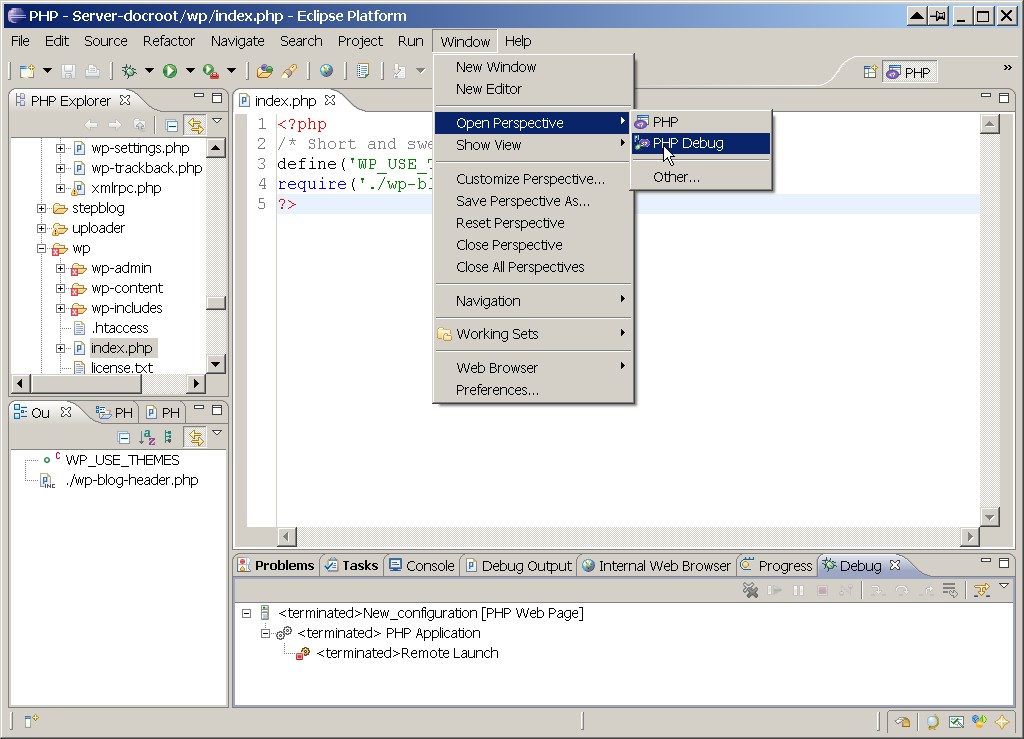
- Change to PHP Debug Perspective: Window->Open Perspective->PHP Debug
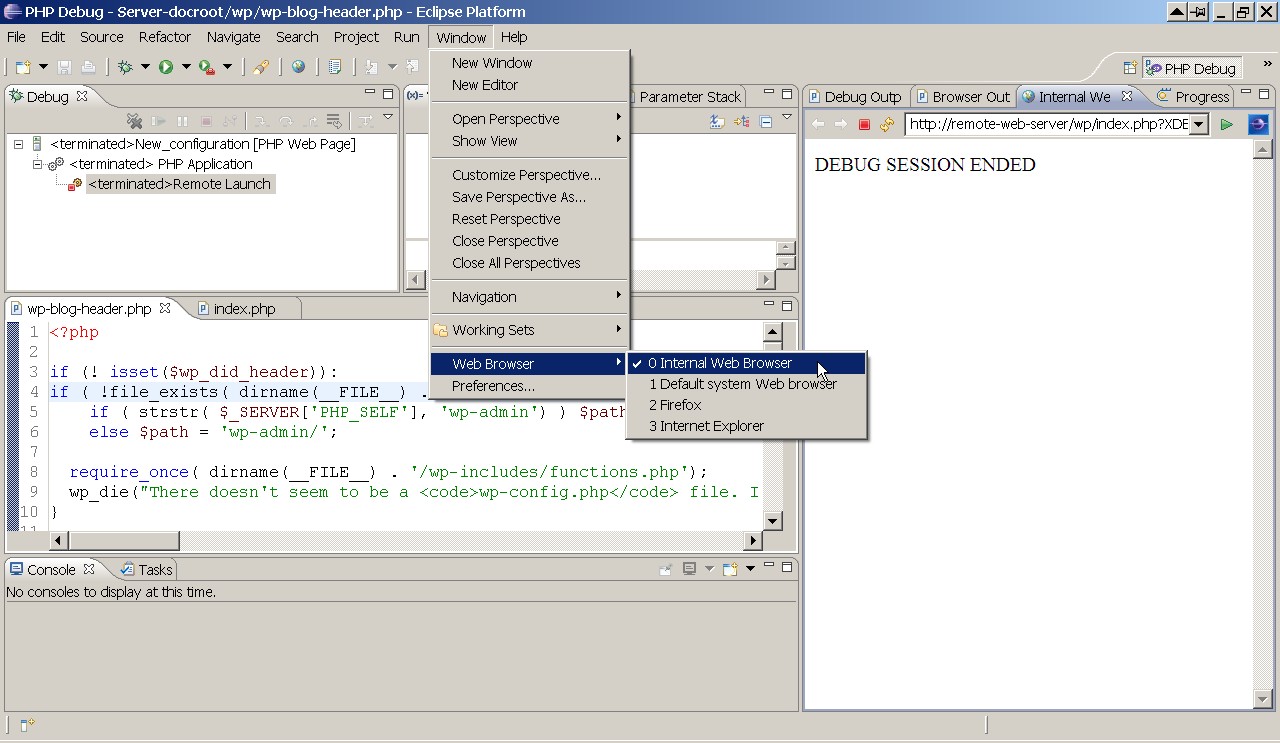
- Window->Web Browser
- If “0 Internal Web Browser” is available, you can choose that to have the browser inside eclipse. I have found that this option is only present if IE is running before eclipse is launched, otherwise this option is not available.
- If “0 Internal Web Browser” is not available, I found that “0 Default system Web Browser” doesn’t seem to work for me and that I have to choose either Firefox or IE in order for debugging to work. If you really want to use the internal web browser, then quit out of eclipse, launch IE, and then launch eclipse again. The internal web browser option should be available now.
- If your webserver is on a remote machine, do the following now:
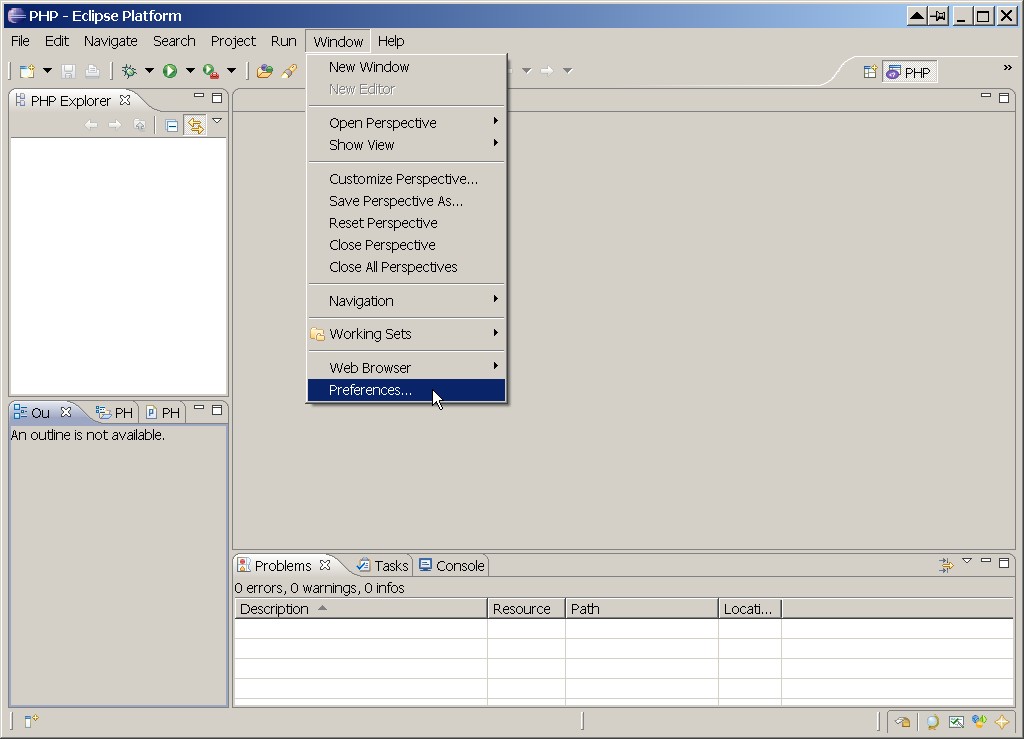
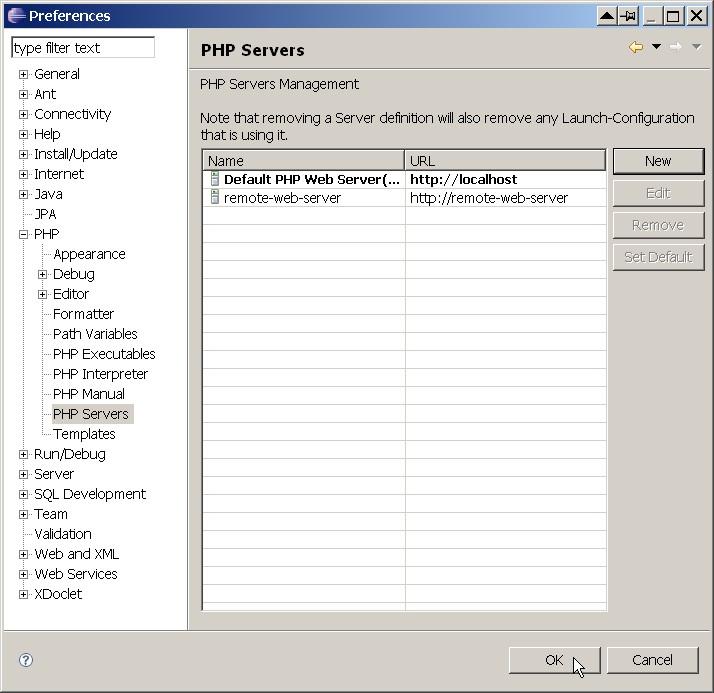
- Do Window->Preferences
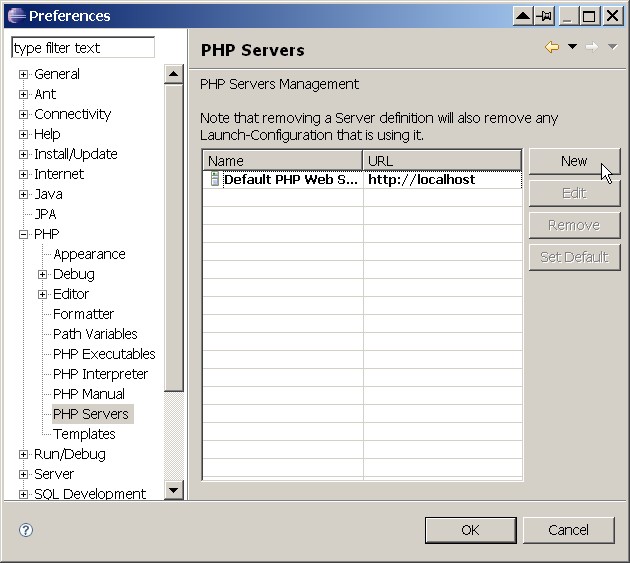
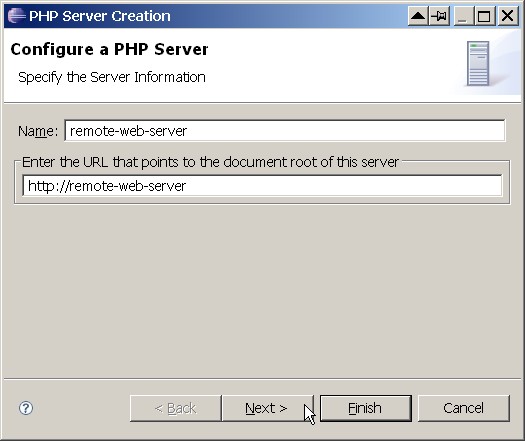
- PHP->PHP Servers Window: Click “New”
- Name: Provide a name to refer to this server in eclipse
- URL: Enter the URL of the document root of the remote server
- Click “Next>”
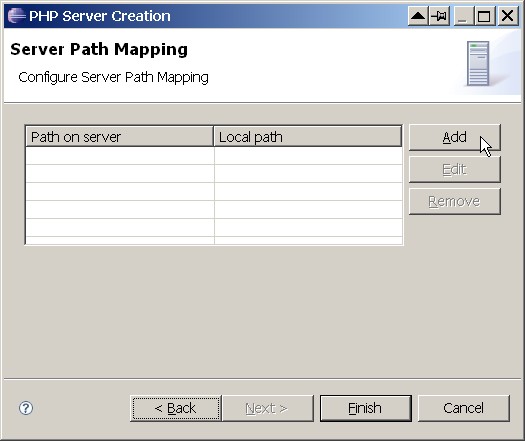
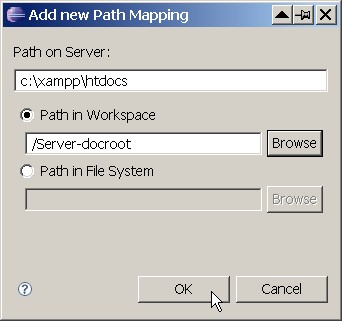
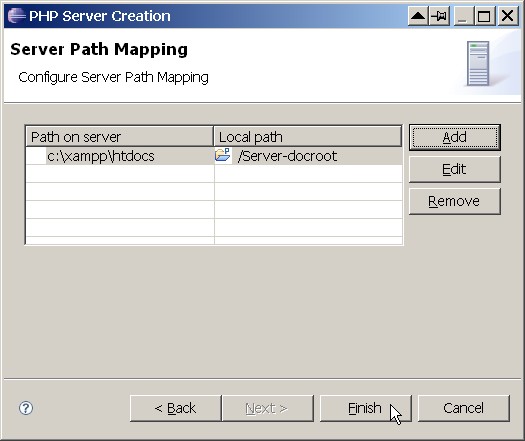
- Server Path Mapping Window: Click “Add:”
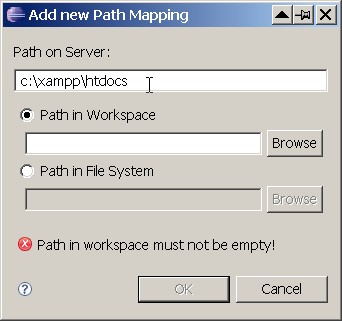
- Path on Server: if the docroot on the server is at c:\xampp\htdocs on the server machine, then put that here, otherwise put the docroot path of the server (remember, c: is the server’s c: drive)
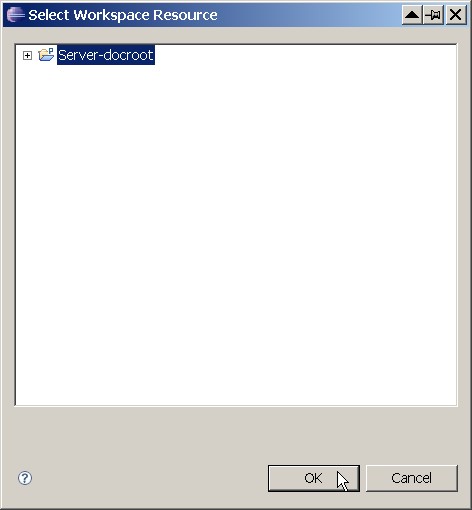
- Click on the radio for “Path in Workspace” and press the “Browse” button. Select the workspace resource corresponding to the docroot (should be the only thing listed – this should be the name of the PHP project that you provided earlier – this guide used the project name “Server-docroot” ), and click “OK”
- Click “OK” (in “Add New Path Mapping” window)
- Click “Finish” (in “PHP Server Creation” window)
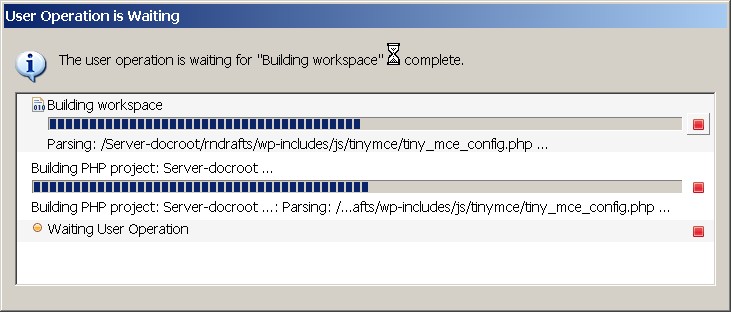
- At this point, you might see a window titled“User Operation is Waiting”, just be patient until this window disappears on its own before going to the next step.
- Click “OK” in the Preferences-PHP Servers window.
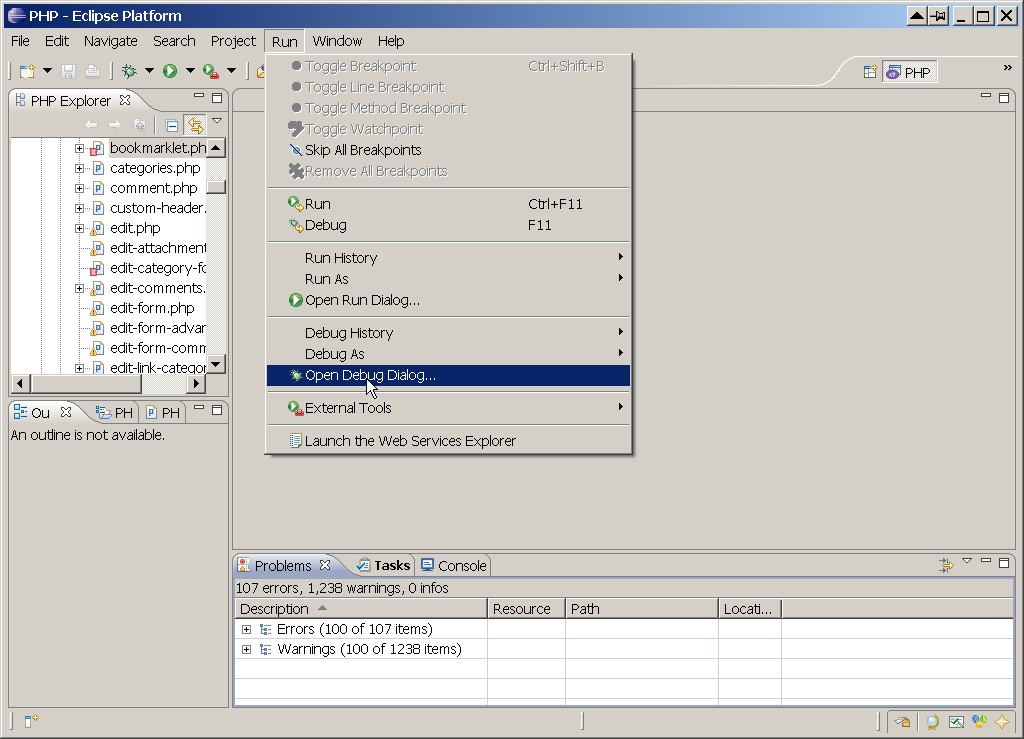
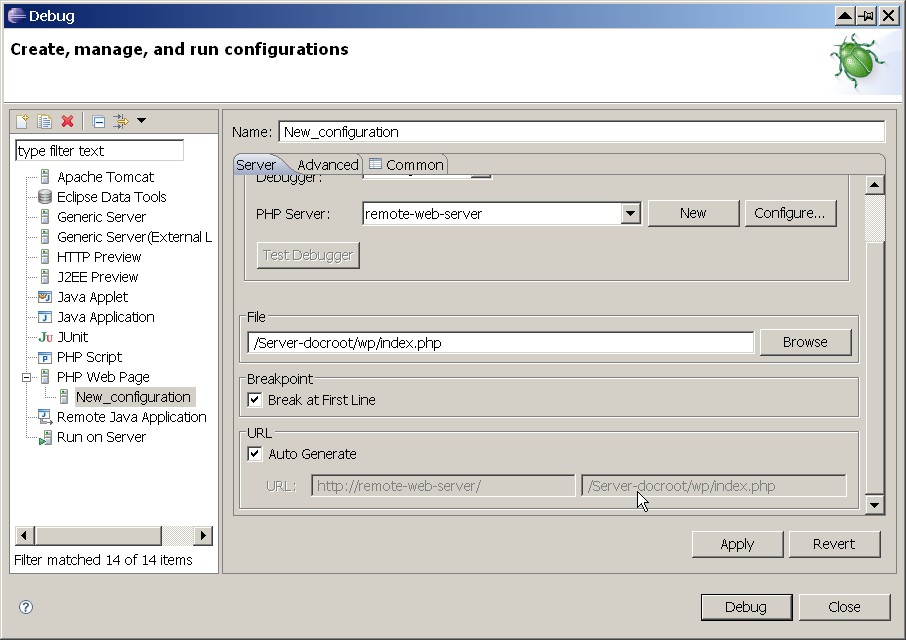
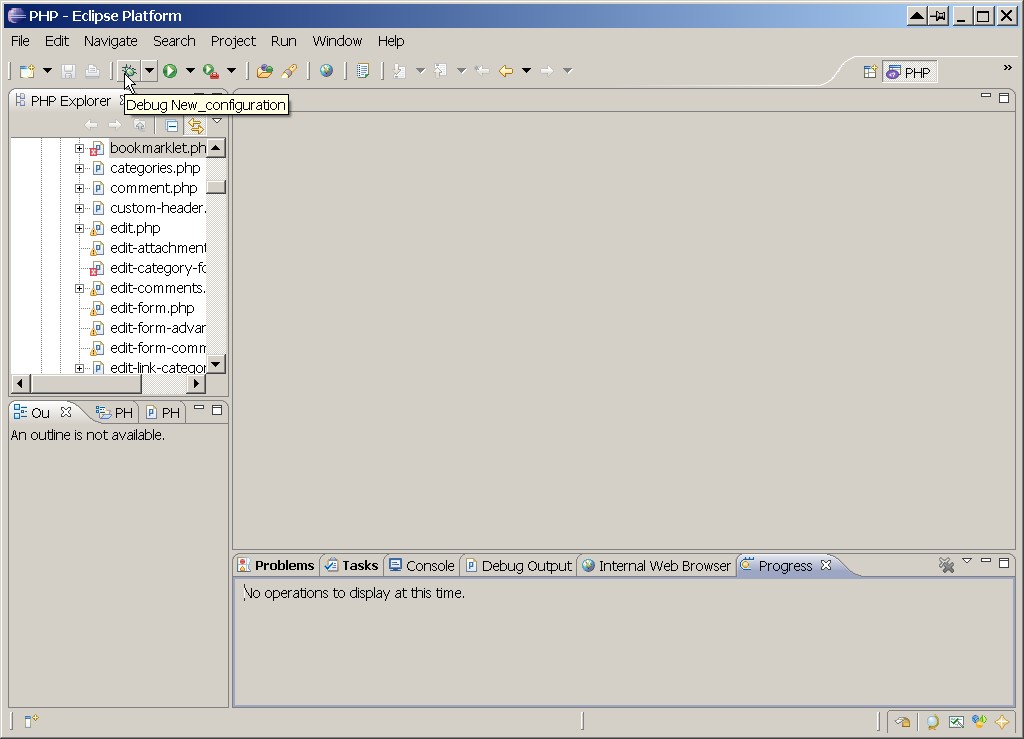
- Run->Open Debug Dialog
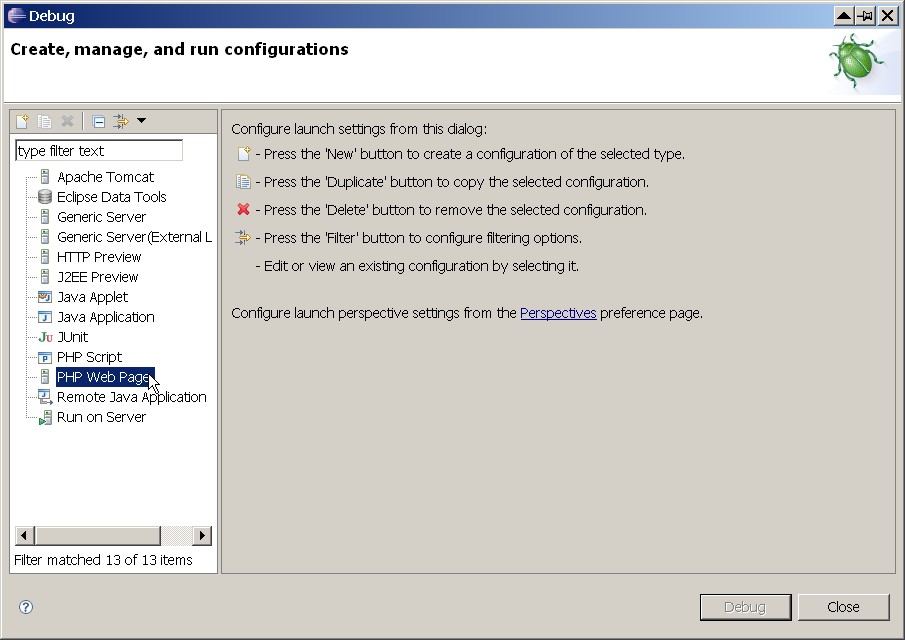
- Double-click “PHP Web Page”
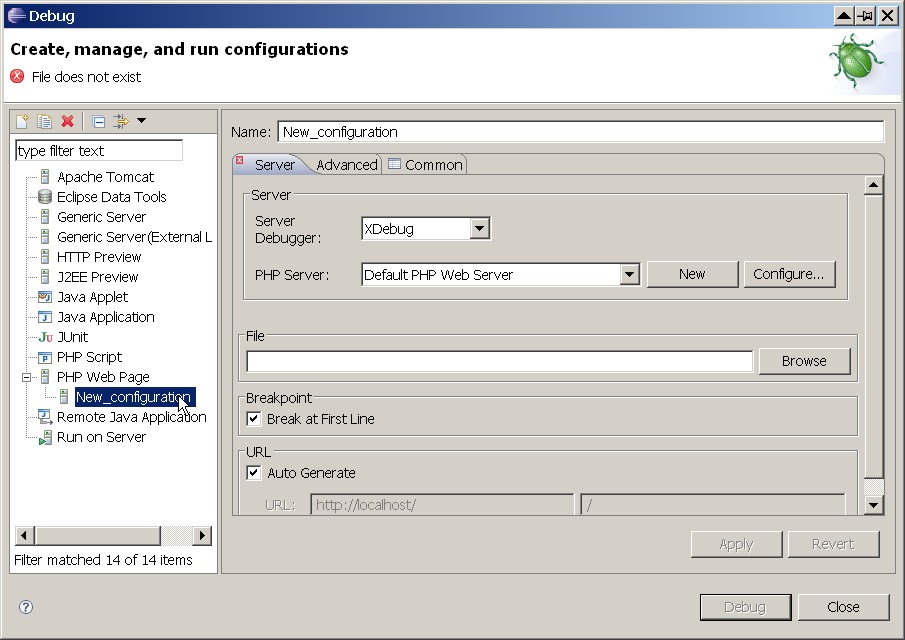
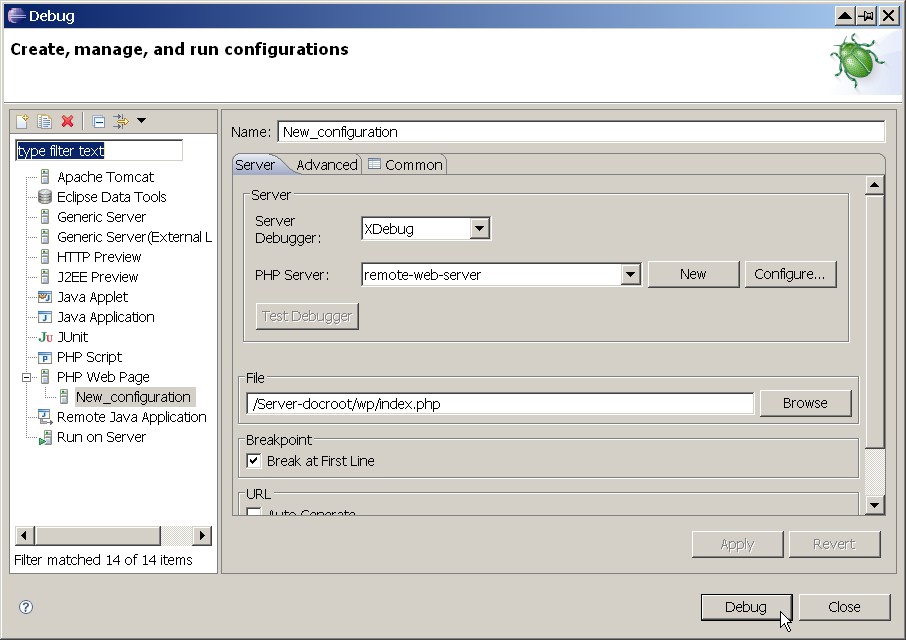
- “New configuration” is created as a sub-item under “PHP Web Page”, highlight it
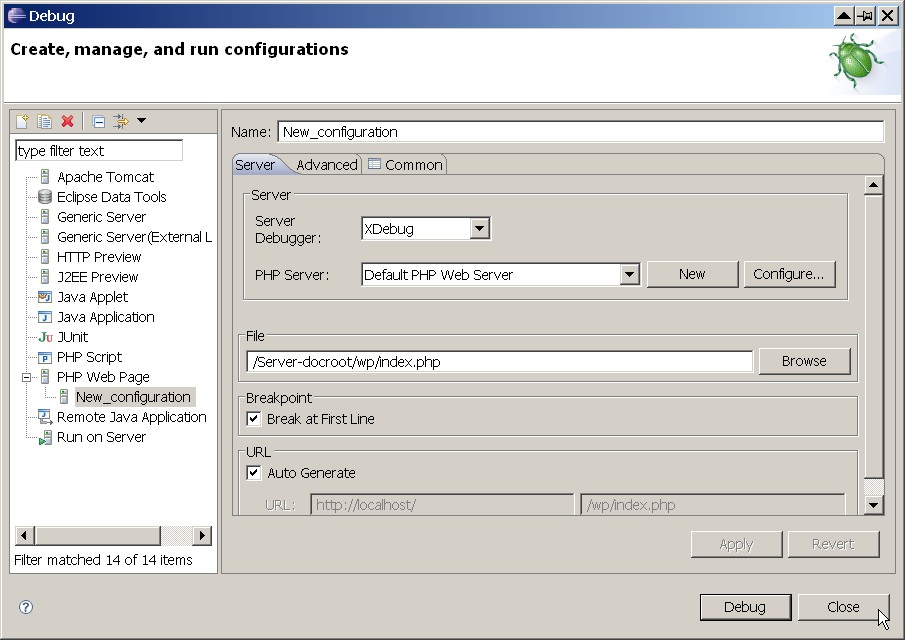
- “Server Debugger”: should be “XDebug”
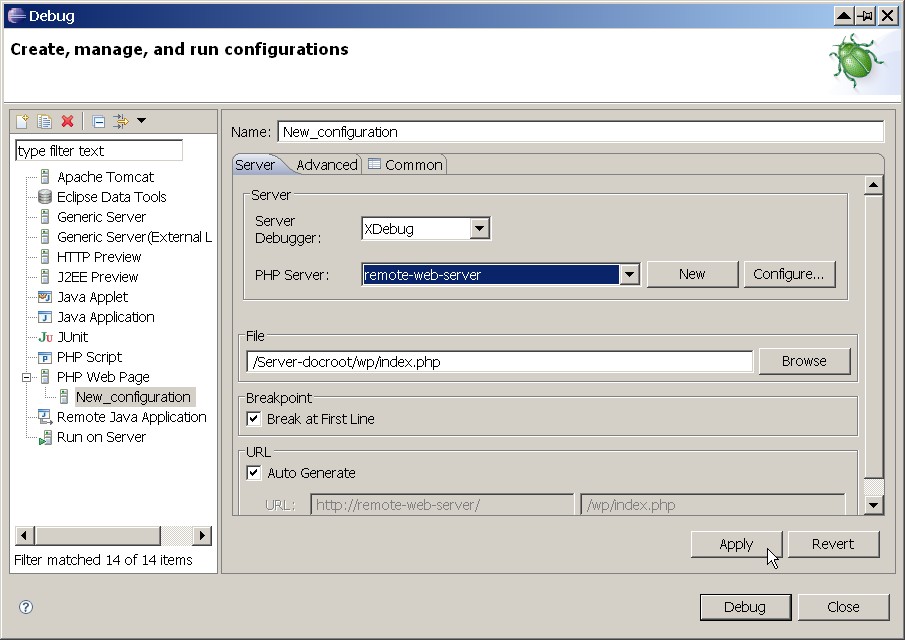
- “PHP Server”: choose “Default Web Server” (if your web server is on the same machine) or the remote server that you created earlier.
- “File”: Browse to a file in the project that should be launched in the browser for the debug session.
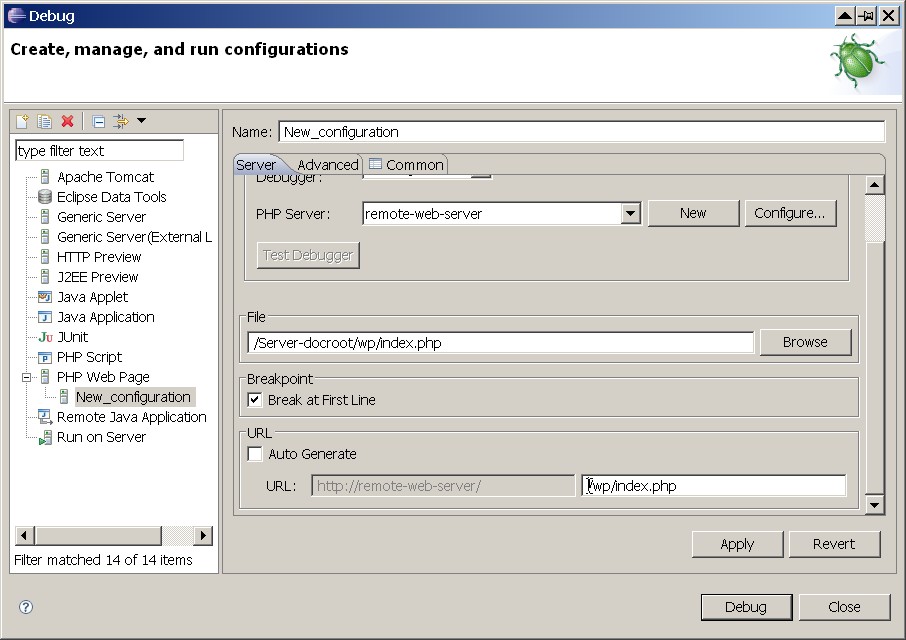
- If “Auto Generate” is checked (localhost example, remote server example, a URL to the chosen file on the server should be auto-generated and should look correct. If not (or if you want to add GET parameters), then it needs to be manually edited (after de-selecting “auto-generate”) to match the correct URL.
- With the R20080603 PDT all-in-one package, it seems to add the project name into the URL when auto-generate is checked, which is not correct. You’ll need to uncheck auto-generate and remove the project name from the URL to make it work. It is unfortunate that it does this, the R20080103 (v1.0.2) release did not do that.
- Click “Apply”
- Click “Close”
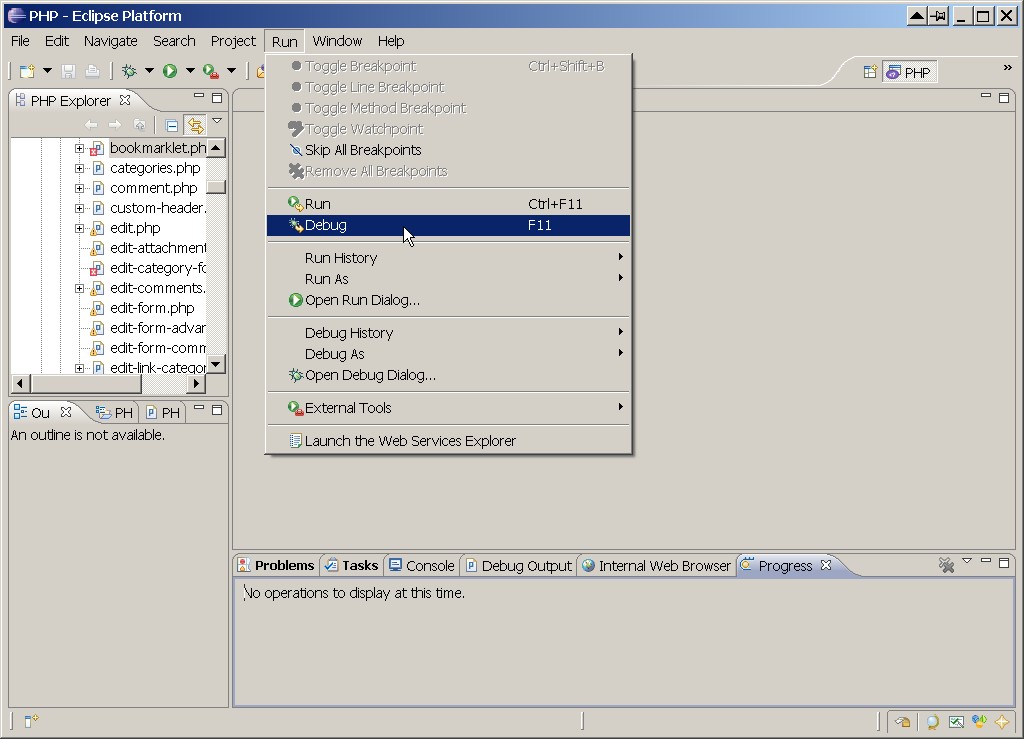
- Run debug session
- Do either: Run->Debug or F11 or click the bug icon in toolbar
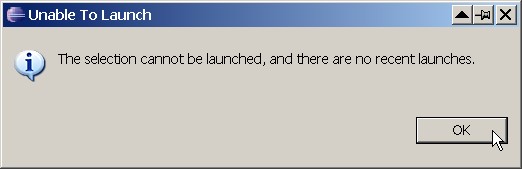
- If a window pops up at this point which states “The selection cannot be launched, and there are no recent launches”, then do the following
- Run->Open Debug Dialog
- Highlight “New configuration” under “PHP Web Page”,
- Click the “Debug” button
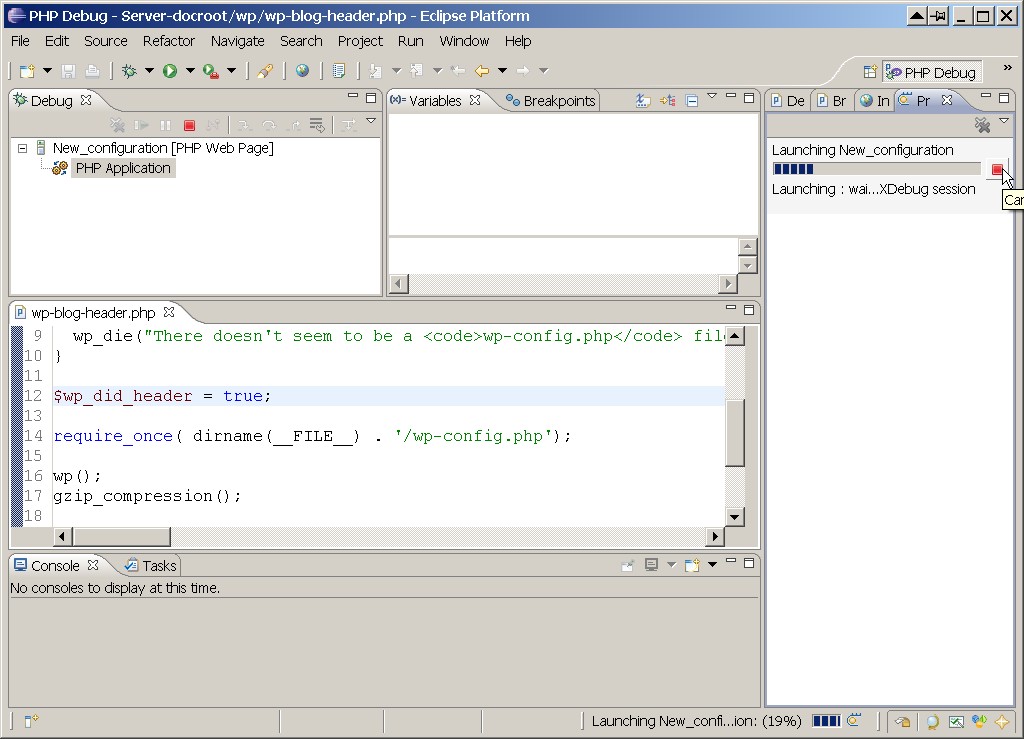
- If the debug session isn’t starting, and you are seeing in the lower right corner “Launching New_Configuration” with a progress bar that keeps moving, then, then do the following:
- Click the button to the right of the progress bar.
- Now in the right pane you’ll see a red square button, click it to get out of this faulty debug session.
- If the web browser came up with the page you are trying to debug, it means XDebug is not installed on the server properly. Go back and get XDebug installed on the server and try again. One common mistake that causes this to occur is that you may have modified the wrong php.ini file, make sure you modified the right php.ini file. You can test if XDebug is installed properly by opening a .php file in your browser that calls phpinfo() and see if XDebug is in the resulting page – make sure this is the case. Also, make sure that xdebug.remote_host is pointing to the machine running your debugger (if you use a different machine to debug sometimes, you need to change this).
- If the web browser did not come up, then in the pull-down menus, do “Window->Web Browser”
- If it is set to “Default system Web Browser”, then this is the problem and you must switch off of it.
- If “0 Internal Web Browser” is available, choose it.
- If “0 Internal Web Browser” is not available, and you want to use the internal browser in eclipse instead of IE or Firefox, then quit eclipse, launch IE (and don’t close it), and launch eclipse again. Before running your debug session, do “Window->Web Browser” and check that “0 Internal Web Browser” is available. I have noticed that for some strange reason, if you don’t do “Window->Web Browser” before your first debug session, the internal web browser doesn’t seem to be available.
- If you want to use Firefox or IE, or if “0 Internal Web Browser” is available, then choose Firefox or IE
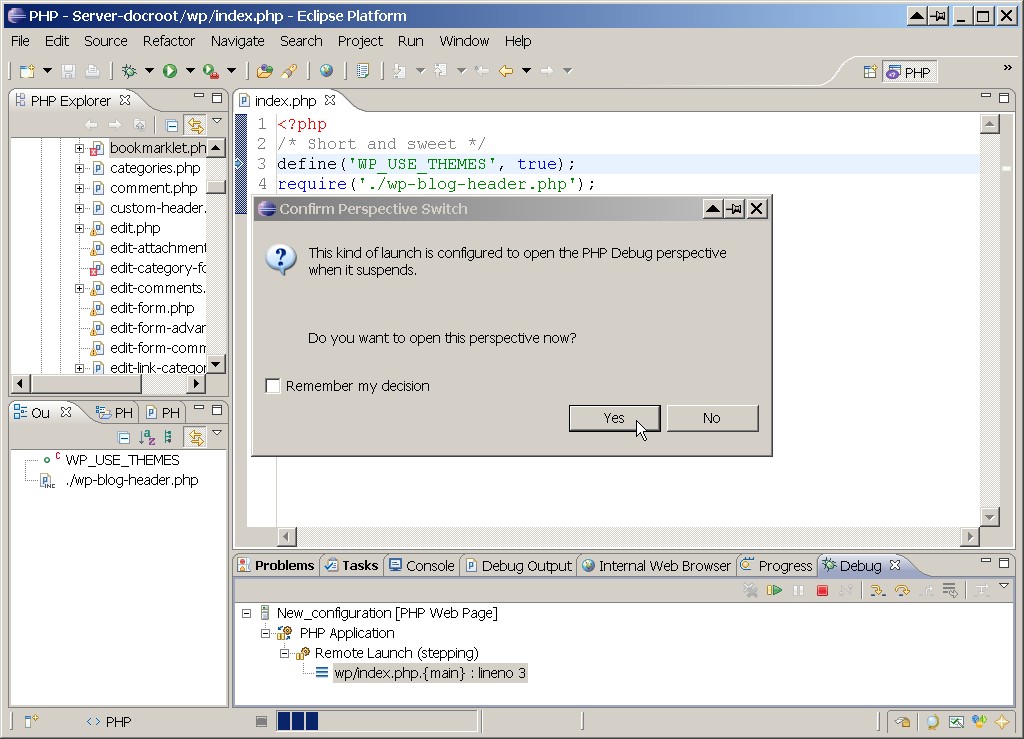
- If the “Confirm Perspective Switch” window pops up, check “Remember my decision” and click “Yes”
- If a window pops up at this point which states “The selection cannot be launched, and there are no recent launches”, then do the following
- You now have a debug session going, have fun setting breakpoints, stepping through code, and looking at variables!
- Do either: Run->Debug or F11 or click the bug icon in toolbar
- Ending the debug session
- I have noticed that once the php script runs to completion, the debug session is still running. This is because if you navigate to another page it will also go through the debugger (this assumes that you have “Debug all pages” checked in Run->Open Debug Dialog;PHP Web Page/New Configuration;Advanced Tab).
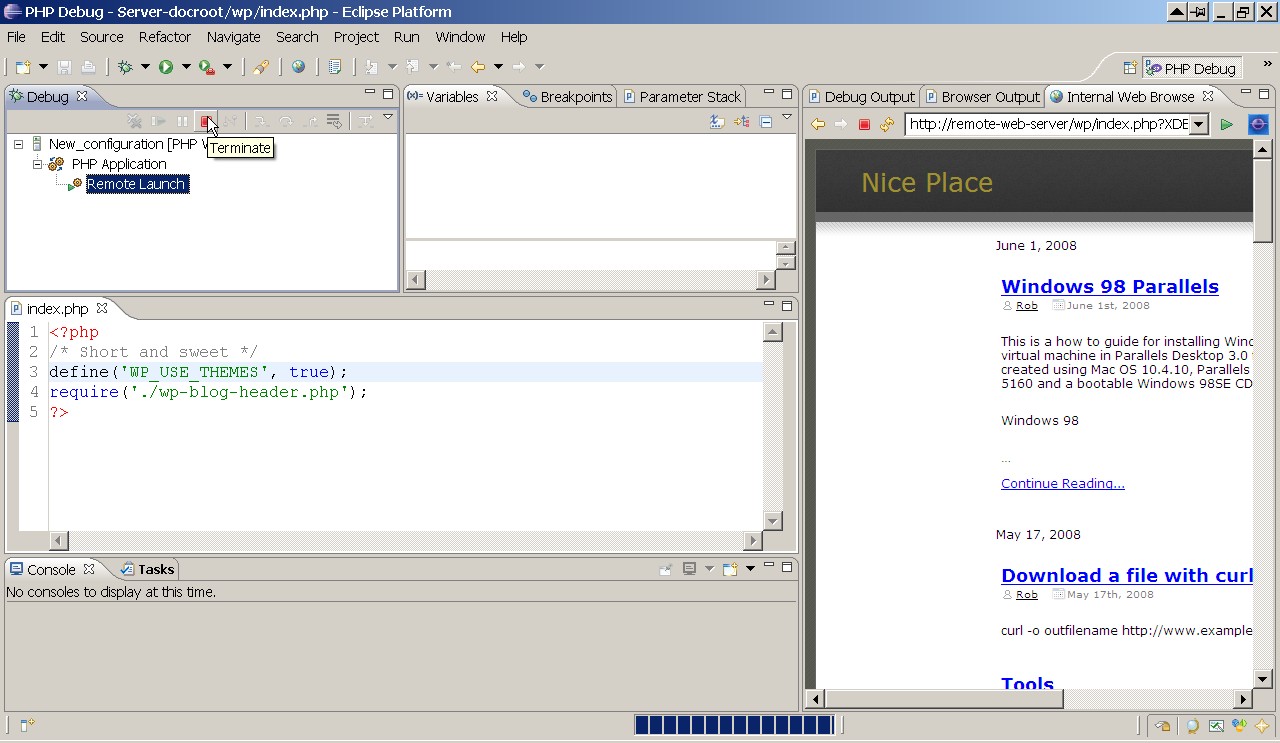
- To end the debug session, allow the current PHP script to run to completion and then highlight the “Remote Launch” in the “Debug” window and press the red square button just above it to terminate the session.
- Changing which file you want to debug
- If you want to debug a different PHP file, you will need to go back to the Run->Open Debug Dialog screen, and in PHP Web Page/New_Configuration, you’ll need to change both the file and the URL to the new PHP file.
- Happy Debugging!
I haven’t used this debugger much yet as I have only gotten to set it up. I’ll be adding more notes when I learn more.
One of the limitations I’ve found is that for the first page you navigate to, it seems that you can’t specify what is to be given in the “POST” data of the webpage. If you want to debug the “POST” method to a PHP page, then make sure you have “Debug all pages” checked in Run->Open Debug Dialog;PHP Web Page/New Configuration;Advanced Tab. Then you should let the PHP script run to display a web page with a form. When you put the data into the form and submit it, the debugger will now allow you to debug this page with the POST data.
Useful Links:

Thanks for this guide. It has been quite useful.
Unfortunately I still cannot debug. When debug session starts, at Step 8.ii, browser window (either internal or external) pops and displays the result page. At the same time I can see progress bar stuck at 19%, and always launching. There’s no debugging at all.
I’ve follow XDebug guide to configure php.ini, and it seems dll is properly set. I’m not using XAMPP (WAMP instead). Those are my system settings:
PHP 5.2.6 -> php_xdebug-2.0.3-5.2.5.dll
Apache version 2.2.8: no debug, and tread safe ->
[XDebug]
zend_extension_ts=”C:\wamp\php_xdebug-2.0.3-5.2.5.dll”
xdebug.remote_enable=true
xdebug.remote_host=127.0.0.1
xdebug.remote_port=9000
xdebug.remote_handler=”dbgp” ; added double quotes
xdebug.profiler_enable=0
xdebug.profiler_output_dir=”C:\wamp\tmp”
Eclipse all-in-one PDT : R20080603
Any idea would be appreciated.
Anyway, thank you very much.
I solved on my own. I was writing on a wrong php.ini file.
Newb mistake.
Best regards
Rob…Excellent details. I have all the components installed on my system, but I would like to know if it has the following capability:
I have a copy of a very complicated live website running on my local apache server (Windows XP, Apache 2.2.3, PHP 5.2.5, MySQL5.051). It has a shopping cart, backend, and its own CMS system. I am using this local copy for development of new functions and debug. I currently access the website copy through a local browser using “http://localhost/local-websitename.com/index.php” and then login to the website. If, for example, I’m debugging the shopping cart checkout function, I would add items to the cart, set the quantities, discount codes, shipping address, etc., and then proceed to checkout. At this point, I would want to start up the debugger and set a breakpoint at the beginning of the checkout.php function and then step through the code.
The impression that I get from reading the documentation is that I must set up all the parameters within the debug session (GET parms) and then start running the code. There are way too many variables for me to set up manually every time I want to debug a different area of the code.
Is it possible to hook the debugger into existing code without a big hassle?
Thanks in advance for you help…Rich
Rich: I think that what you are requesting is possible. The debugger allows you to fire up a webpage and navigate to different webpages until you hit a breakpoint on some other page. What you want to do is inside the “Run->Open Debug Dialog” menu, uncheck the “Break at first line option” so that you don’t halt for stepping at each new page that is loaded. Also, you should set a breakpoint at the desired place in your checkout.php code. Additionally, make sure the “Debug all pages” is set in the advanced tab of “Run->Open Debug Dialog”. At this point you can start up with page that you want to start from, and it should open in your browser without hitting any breakpoint. Enter in everything you need to do for any forms on this webpage, and click your checkout button or whatever you use to submit data to, and when you hit the breakpoint in checkout.php, you should be able to step through it and do all the useful debugger stuff.
Rob… Thanks. I’ll give it a try
Worked great! I’m sure I never would have gotten this to work without your tutorial. Enjoy the donation!
Rich: Thanks so much for the donation! I’m glad I was able to help you.
Rob… Everything is running fine, except that I can’t get breakpoints to work. If I set “break at first line”, it correctly breaks when I start debug. At that point, all the step functions work correctly, but after I click “resume”, it will not stop at any breakpoint. To ensure that I am really executing the breakpoint line, I set a break point on an echo command which is “echoing” the output correctly. So I know the line is executing, but the program does not break. The line with the breakpoint has a green circle to the left of the line and there is a “check” mark on the line reference in the Breakpoints section. Am I doing something out of sequence, or did I forget to enable something? Any help will be greatly appreciated. Thanks in advance…
Rich: I just tried it and after some success getting breakpoints to work, they stopped working at some point. I tried restarting eclipse and restarting my web server, but neither seems to fix the problem. Breaking on the first line does work. I’ll try some things and see if I can figure it out. Maybe you should search the PDT newsgroup or post a question there. I really haven’t used this debugger much, just got it set up so that I could work on a project (which I haven’t started), and wrote my notes for setting it up on this page. I wish I could help more.
A link to the web interface for PDT newsgroups is:
http://www.eclipse.org/newsportal/thread.php?group=eclipse.tools.pdt
Great tutorial!
For those who like video tutorials I have prepared some about Eclipse PDT and XDebug. You can find it on my video blog at http://www.TheOrangeIT.org
Thanks
Finally got it working! The problem was (is) that through my use of VirtualHost directives, I can refer to my local website as http://localhost/websitename.com/web/ OR http://www.websitename-local.com OR http://secure.websitename-local.com All of them point to the exact same DocumentRoot on my local PC.
It turns out that you can’t mix them during a debug session. It is not enough to set the breakpoint in a particular file as the debugger must also be looking for how the file is referenced by the browser. Since my site simulates secure and nonsecure pages, I set up two remote servers (instead of localhost) that point to http://secure… or http://www…. depending on what I am debugging. It is a little cumbersome to switch from one to the other (I can only get it to work if I terminate the existing session and start a new one using the correct “server”.)
Excellent tutorial, Really useful.
Thanks a lot pal!!
I’m having trouble getting all this to work. I’ve got PHP installed on a remote server, and I *was* able to successfully install Xdebug. However, I can’t get eclipse + PDT to stop at any breakpoints. When I open the debug dialog, I tell it where my php server lives and all seems well. When I start debugging, the webpage opens but it does not stop at the break point. Instead, the page finishes loading, and my eclipse + PDT just sits there and says that it’s launching ‘index’. It’s stuck at 19%. The step through, step over, etc. buttons never become available.
I hope you can help.
Thanks,
Chris
Chris: Does debugging work for you if you tell it to break at the first line? I’m just trying to get more information to help you. Have you also verified your Xdebug installation by loading a .php file that calls phpinfo() to make sure XDebug is properly installed? Also, I found that for remote server debugging, you can’t use the filesystem for the path mapping, you need to point to your workspace. I created a bugzilla against Eclipse for that: https://bugs.eclipse.org/bugs/show_bug.cgi?id=238912 Seems it is fixed in a later release of PDT.
Rob, no. Checking “Break at first line” doesn’t change anything. I have verified via phpinfo() that xdebug is installed properly. I followed your tutorial and the video tutorial that ralphz posted.
I don’t have to have php installed locally, do I? That is, installed on the same machine on which I’m running Eclipse? I’m running eclipse on my WindosXP laptop, and php on a fedora core server.
A friend of mine was able to follow your tutorial (installing xamp locally on his machine) and get everything working just fine. So the only difference here *seems* to be that I’m trying to do what I suppose is called “remote debugging”. Am I supposed to be able to debug with this sort of set up?
Chris: You should be able to debug remotely, and I have done this using 2 windows XP machines, one with the debugger and one with the server, so it should work for you too. Sounds like it is having trouble making a connection to XDebug. Maybe you can turn on the XDebug log (put: ‘xdebug.remote_log=”/tmp/xdebug.log”‘ into your php.ini and restart your apache), and see if your XDebug is receiving the commands from the eclipse debugger (by looking at /tmp/xdebug.log).
The other thing I would do is make sure you have setup your remote server in eclipse properly (everything under step 7.h), and that you are pointing to it in your debug dialog. For the path mapping, make sure you are using “path in workspace” and not “path in filesystem).
Rob,
I think that this line in the php.ini might be my problem:
xdebug.remote_host=127.0.0.1 ; if debugging on remote server,
; put client IP here
my laptop is behind a firewall, so will I not be able to debug in this case? my internal address is a class c private address. I’ve tried both that address and the address of my router, but neither seems to do the trick. When you’ve debugged remotely before, what did you use for this setting?
Thanks,
Chris
Bah! That’s going to be the problem I think. I just found this post over at http://tech.blog.box.net/2007/06/20/how-to-debug-php-with-vim-and-xdebug-on-linux/, it reads:
Gavin,
Not a problem, as long as the webserver has access to your debug machine. Simply
change xdebug.remote_host = , and change xdebug.remote_port = . The only problem
might be that you might need to set up your router or firewall to allow and route
incoming requests to port 9000 (or whichever port you choose) to your local
machine. Good luck!
Then this guy Gaven responds back with (in part):
Aaaah yes. Thanks, that was it.
So it seems that it’s a firewall issue. I’ll have control over that at home, but not quite so easily from work (I’m a contractor so I’m not always at the same client all the time).
Rats.
Any advice? Should I just install xamp locally on my xp box and debug that way? Will it make much difference that I’m writing and debugging in one version of PHP for windows and hosting the production site on a linux box running a different version of php?
If your firewall doesn’t block port 22, you could ssh from your work machine to your home machine, and tunnel the port through SSH. But if you are only doing this because you are afraid that windows PHP is different than linux PHP, I think that the differences would be so minor (unless you are running external UNIX commands, and even that could be emulated with cygwin) that it shouldn’t be an issue running locally on XAMPP, which would probably be faster anyway since its on the same machine and you wouldn’t be going through firewalls and the public internet.
Great tutorial, although it did not work for me until I combined this one with one at 102degrees. My setup is Eclipse PDT together with UsbWebServer.
First I ‘installed’ the USBWebServer together with Joomla. After that I followed Robs tutorial (Because of the USBWebServer I had to make the Xdebug changes to a settings.ini).
However the debugging didn’t work. So I read all the comments found here, and then went on searching on the net. There I found this link to a blog on 102degrees. In the Settings.ini I set ‘implicit_flush = On’ and ‘output_buffering = Off’. And I switched back to version 2.0.2 of the XDebug DLL.
Then next day I could not get it working anymore. So I switch back to the 2.0.3 Xdebug DLL, hoping that might fix the problem. Sadly it didn’t. But as usual it was I who had messed things up, fortunately I found the problem after a short while:
My UsbWebServer runs on port 8080. So I set that up in Eclipse, however somehow I had also set ‘xdebug.remote_host’ to localhost:8080 in my settings.ini, which left the debugger hanging at 19%…
So I set the ‘xdebug.remote_host’ to localhost only. And now I am happy to say I run a fine debugger using Eclipse and the latest Xdebug DLL (2.0.3)
So thanks again for a great in-depth tutorial!!
Paul
Many thanks to you. Although I’m using Linux but this guide is ok to me. I’ve debugged successfully ^^
Hello and thanx for the article.
I can work that fine, but i have a problem. I use mod_rewrite to make the URL friendly and i know that the debbuger insert in the url XDEBUG_SESSION_START=ECLIPSE_DBGP&KEY=12198785081253.
How can i do to debug without remove the mod_rewrite rule.
Email plase…
Thank you
Rob,
I follow your tutorial for debug session on a local PC. My problem was, debug session was starting but even does not stop on first line when checked.
I read your response to Chris Jordan comments and turn on XDebug logs, and I do not understand why but it seems that it has solved my problem.
For your info.
Thanks a lot for the tutorial.
It looks like everything is going smooth, but breakpoints doesn’t hit.
Any ideas?
Same problem for me. I followed the tutorial to the letter. I have eclipse, php and the web server on the same box. I am using xampp, but to my dismay, I can’t get the debugger to stop on break points. Any help would really be great.
If you aren’t hitting breakpoints, I suggest to turn on the debug log to get more clues as to why your breakpoints aren’t being hit. Also, if you are using virtual hosts or renaming of your URLs, there may be issues – you may need to debug without that.
Thank you so much for taking the time and effort to produce this tutorial. Every step is there, no assumptions etc gets the job done! After a few hours messing about with some other websites I thankfully came across this site. Got it all up and working within half an hour (including the download of PDT!)
Hey Rob,
your tut helped me setup Eclipse with Zend :). just applied some things i didnt understand to other tutorials…
had a few questions…
Just curious, the remote server you setup, I didnt quite understand how the workspace/Server Path Mappings worked.
Like for a simple localhost php server, you got your workspace pointing to your local apache in pretend C:/htdocs. Any workspace defaults to being created/edited there, and uses the default PHP Server aka http://localhost when testing a PHPWebpage. like site1 project shows up in C:/htdocs/site1 and http://localhost/site1 (unless setup a new PHP server for nicer setups that involve like vhost/hosts rules so points to http://site1.local but anyway…)… when you setup a remote server. how does that work here…
It seems like you are setting up a workspace on a remote machine on LAN?,
and since giving //IP/computerpath, so the files are automatically saved on that computer over the LAN?
(seems like a weird setup, like is it another web server computer inside the network that you have access to, maybe to test things on?
versus a real remote machine like a outside host where developing in local sandbox and pushing to a remote machine via ftp)…
Anyway when you setup the remote PHP Server, why do you need to put Server Path Mappings? like when you created a new project, didnt it save in htdocs?,
like serverCdrive:/htdocs/Server-docroot. it almost seems like when you created the workspace that it corresponding/aliases to /Server-docroot to /htdocs which i didnt eclipse it does when creating custom workspace for project. and it seems like Path Mappings are set to help tell Eclipse how to associate the alias to an actual server location. Can you explain the remote setup in a lil more detail based on my above confusing 🙂 questions. like what would happen if you didnt include those Server Path Mapping settings.
Thanks Rob, best Eclipse setup tutorial yet.
I would add … PHP Executables can be custom setup so scripts can run on any php executable version you have by pointing to it ( versus pointing to actual php/web server combo). Can add mysql support to default PHP Scripts (which uses php binaries built-in eclipse) by enabling copying over
php_mysql.dll to (on Windows) C:\Documents and Settings\ach\Desktop\eclipse\plugins\org.zend.php.debug.debugger.win32.x86_5.2.14.v20080602\resources\php5
and libmysql.dll to \php5\ext
Also can add Zend debugger support instead to your PHP Webpage by adding Zend dll to your server and doing soemthing like this to your PHP Server’s php.ini…
zend_extension_ts=”C:\dev\php\ext\ZendDebugger.dll” #without _ts for linux
zend_debugger.allowed_hosts=127.0.0.1/32,192.168.79.1/24,192.168.177.1/24,localhost
zend_debugger.expose_remotely=always
implicit_flush = On #change these settings
output_buffering = 0 #change these settings
another question: you prefer XDebug free version debugger to Zend’s debugger, any features you can mention?
just putting Drupal as a Eclipse project copies over all Drupal for code completion :).
thanks,
Arian
Hi Arian:
Thanks for your comment.
Yes, the remote server setup that I have documented here is just a remote server on my local network, not one that is accessed via ftp. I haven’t debugged in the sandbox of my real site, so I never set that up (maybe someday). My setup is just what I have at home. My home situation is that I have a server machine that doesn’t move, while I debug on my laptop – where I can be anywhere in my house.
In a remote debugging setup that is not on the same LAN, you would have your local machine running the debugger, and your server machine running the actual site. Eclipse does not access the files on your remote site via ftp (this access is needed in order to display your source when you breakpoint or step), it only accesses files on your local machine. Therefore, it is very important that you have an exact copy of these files on your local machine. If you set a breakpoint in a source file on your local machine via eclipse, eclipse must know how to tell the remote server which file to breakpoint on. This is where the file mapping comes in. With having 2 copies of the files – one on your local machine and one on the remote machine – you tell eclipse how to map the files on your local machine to the remote machine so that breakpoints can be set on the remote machine (based on you manipulating files on your local machine), and also so that when the remote machine hits a breakpoint, it can communicate the correct file that the breakpoint is at to your local machine.
If you didn’t set the mapping, when you set a breakpoint on source on the local machine, it will communicate the location on your local machine to your remote machine – and it may be under a different directory structure in your remote machine. Your remote machine only knows files in its directory structure – it doesn’t know the files on your local machine’s directory structure. As a result – you wouldn’t hit the breakpoint.
My reason for XDebug in this tutorial is simply that it is free. I don’t do PHP professionally, it is just a hobby. I therefore don’t want to invest money in tools, and am happy with free stuff. I never used Zend, so I can’t say whether it is better or not, but since it is a paid product done by a company that makes its money off PHP, I would bet it is probably much better than XDebug. For my uses so far, XDebug has been good enough.
Regards,
Rob
Hey Rob, Thanks for the followup,
had a few more follow up questions if you have some time for another long-winded comment 🙂
>In a remote debugging setup that is not on the same LAN, you would have your local machine running the debugger, and your server machine running the actual site. Eclipse does not access the files on your remote site via http://ftp…, it only accesses files on your local machine… Therefore, it is very important that you have an exact copy of these files on your local machine.
Think i am following you… makes sense remote machine needs breakpoint info from your files and needs to know how to get that info. Just for clarification: In the remote debugging setup like yours though where the workspace files you are debugging in Eclipse are actually on the remote machine itself, do you need to setup server mappings as the server has the exact files you set the breakpoints on?
Like since no development in this remote setup occurs locally, Does eclipse need to know mapping of local to remote machine in this case?
So let me bring up the situation where it is not on same LAN… im not sure if this is how it would really be setup but ill take a guess, let me know if sounds about right…
Pretend You have a project on local dev machine, c:/htdocs.
and kinda test there locally (like pretend in Debug settings, you have the PHP Server settings for http://localhost, aka your local webserver with the debugger installed on it). Then you feel comfy testing locally, and might want to transfer the files over to a remote staging or production machine pretend http://stagingserver (a remote machine that also has debugger installed).
Then to test via Eclipse, change the Debug settings so it uses that staging PHP Server (with server mappings set), so when you are debugging a webpage with breakpoints, it uses http://stagingserver's debugger to use what breakpoints you currently have open in Eclipse on it’s server copy of that file. so i guess if you dont have an updated copy on the server when debugging this way, havoc ensues :).
So with a debugger i guess this is how remote debugging works…
you setup a breakpoint in local workspace file on line 455 of homepage.php. When debugging in Eclipse, Eclipse sends the info to the server over some sort of communication protocal, http probably (probably sends info like file, linenumber, server mappings) and Zend Debugger on server recieves this info and send info back to you as it debugs with your breakpoints. so a back and forth communication between server debugger, and eclipse. pdt seems to have option to choose Xdebug and Zend builtin to communicate with the server since you can choose either in the PHP Webpage dropdown.
sidenote: i was intially wondering how xdebug can do this back and forth communication when a ‘XDebug plugin’ isnt in Eclipse to establish communication like Zend has a plugin for eclipse. But realized this Zend plugin is totally unrelated to remote debugging. It just installs a standalone PHP Executable’s with ZendDebugger for debugging standalone php scripts. aka as said above paragraph, pdt has remote server debugging capability i guess builtin for both of those.
btw i understand why workspace didnt default the way it thought. In the Project Location verification screen in one of your screenshots, it says there are already files there, so hence why the Server-Root project is associated with pretend c:/htdocs since it asks you to use existing dir as the project or create a new directory c:/htdocs/Server-Root.
btw I think Zend Debugger itself is free (while the Zend IDE isnt), as it is the default php debugger in Eclipse pdt’s PHP Executables (plus copied the ZendDebugger.dll to my server and Eclipse debugged fine, think you can just dl the ZendDebugger.dll free and also install the ZendDebugger Plugin into eclipse and should work).
Thanks,
Arian
btw anyway to enable converting new lines to line breaks in your blogs comments?
maybe manually adding nl2br() in comment output code of your CMS? all my comments get newlines ripped out so looks much less organized 🙂
Hi Arian:
For the remote setup that I have on my local LAN, the path mapping is still required. This is because on my local machine, the path to the files is //servername/c$/xampp/htdocs, while on the remote machine it is c:/xampp/htdocs, so the client needs to translate the pathname to the server.
From what you write, it seems that your understanding of path mapping on a truly remote system is correct. Glad I was able to help you understand this.
Thanks for letting me know that the Zend debugger is also free. Maybe one of these days I will try it out. Do you know of any advantages it offers over XDebug?
One of these days when I have time, I’ll make newlines appear in my comments. But I just don’t have the time to work on it at the moment.
Thanks for your comments,
Rob
Thanks for clarification. This article helped a lot.
Not sure what differences are. Even differences listed on XDebugs comparision on their site, is pretty much same across the board. Maybe just another choice 🙂
Great work… Thanks lot…
Thanks for taking the time to do this, very helpful. I was missing the step of replacing the xdebug DLL that ships with XAMPP to the one from the xdebug site. Wonder why the one that comes with XAMPP didn’t seem to work… ?
Hi.
First of all, thanks for this tutorial.
I’m a newb at eclipse php. I have just installed and it works. But I see only the global variables. I don’t see my lokal variables at the “(x)=Variables” window. For example:
$testArray = array(1,2,3);
$test=3; //break point here.
With “hover” I can see the value of $test, but not $testArray. It only shows that $testArray is an array and has 3 elements
Can somebody help me here.
[…] Extenso pero simple Tutorial sobre configuración de un Debugger de PHP gratuíto usando Eclipse PDT + XDebug […]
[…] How To Setup a Free PHP Debugger using Eclipse PDT + XDebug […]
@Dritan: See if perhaps the debugger set an implicit breakpoint on the first line of the file. This is a preference on each debug session you create. Try stepping through your code… the the variable listing should update itself. Seeing nothing but the superglobal arrays listed sounds exactly like the session stopped on the first line of your file.
On a related note, I was able to get remote CLI script debugging working via Eclipse, though it doesn’t do it natively — http://thenazg.blogspot.com/2008/12/remote-cli-debugging-via-eclipse-pdt.html
Rob, this is awesome! After some initial messing about, I got it to work and I must say it’s everything I ever needed! Thanks so much!!
Thanks a lot. You have been very helpful.
[…] Até poucos dias eu usava apenas o Notepad++ para programar, ele é bom para edições rápidas, mas nada se compara com a produtividade que uma IDE, como o Eclipse PDT. Nada se compara também a sensação de executar um script linha a linha, sem ter que usar a solução alternativa (‘gambiarresca”) de ficar dando “print_r” nas variáveis e ir ao browser teclar F5. Tutorial aqui. […]
It is possible to get the basic debugging function operational and to see that you can step into code but I find that it just doesn’t quite reach to the full function one expects of such a tool. This may be as much a failing of PHP as of the PDT or anything else. In essence one needs to be able to set a bp anywhere in a process and then step thru code. I don’t find I can do that in general, I don’t believe this ensemble of tools has this capability in general and I advise those who don’t want to waste a lot of time finding that the functionality one normally expects of symbolic debugging just isn’t there yet. I’d be happy to be proved wrong.
Juan: It is possible to set a breakpoint anywhere in the code, and I do this all the time – just open a source file and double click to the left of the line of code to set a breakpoint. You can also view the values of all the variables in the code. There are some things lacking in this debugger, but not the capabilities that you are talking about.
Yes it is possible to set a breakpoint anywhere but not necessarily to GET to the breakpoint at an appropriate point in my overall process, eg. at a complex point in the middle of a session. Part of this is I think due to using Zend instead of XDebug, the latter has more function but is harder to get working. Looking into that now.
I’ve never had a problem getting to a breakpoint that I’ve set. I’ve never tried Zend, and I use XDebug. Should work with Zend also though. I think there must be an issue with your setup.
A lack of attention to detail both in my posting when the title of the page included xdebug and not following thru earlier on assessment that zend lacked function relatively. It is true that Zend works without anything outside of Eclipse but the shortcomings are already noted. Just beginning to get the xdebug branch working but assume full retraction of above unless I post differently and btw I use unix.
BTW, I’m now using PDT 2.0 and can report it does work (even) better than 1.0.x (it’s a major overhaul).
I have done the steps as above , but still i cant open my php file .
Thanks a bunch – some of the eclipse dialogs seemed different when I did this – but it still worked.
Hi Rob, thanks for the tutorial. Your’e missing one thing though, took me about half a day to find.
You can select Xdebug at three different levels: Workspace configuration, Project level configuration and (this one took me half a day) runlevel configuration under RUn -> Run Configurations. Until I had set it to Xdebug there (default was Zend, that’s why it kept listening on port 10000, sigh…) it wouldn’t work, and never seemed to look at the other two config options. No clue why.
Also: I got it working with Netbeans 7.0 m1 without problems, just that I couldn’t get conditional breakpoints to work there (Breakpoint Properties option greyed out). And: Eclipse seems to have the slightly more mature PHP development environment, although I have just started playing with both of them.
Cheers, Nils
For those of you not hitting breakpoints, I had the same problem. Eclipse was using Zend at port 10000 instead of Xdebug at port 9000. The URL you see should contain somethign like this: XDEBUG_SESSION_START=ECLIPSE_DBGP&KEY=12198785081253 If you see a URL with port 10000 in it, then it’s still trying to use Zend. Otherwise, use phpinfo() as suggested in teh post to see if Xdebug is running.
Cheers Nils
I need some help.
I have WAMP installed on C:\wamp.
I have the all-in-one PDT from eclipse.org that is installed in C:\php_pzero_ide. This comes with the zend debugger which I have not used yet.
This is the simple thing that I want to happen.
1. I create a workspace in C:\php_pzero_ide called MyFirstPHP
2. I write a small hello world test.php in it
3. I have the WAMP server running.
When I press the run button on the PDT, it should be able to run the test.php in the internal browser, if there are no errors and display ‘Hello World’. However, if there are errors, it will debug through the file line by line …
How can I achieve this simple thing?
Thanks so much, in advance!
Thanks a lot Rob. It’s great tutorial, even for a starter in PHP like me, could do it.
Nils comment changing the Run->Debug configuration->Server Debugger to use XDebug helped.
Thank you very much for this tutorial, I can now debug my PHP in eclipse, rather than just using echo statements.
Rob, I’ve read your setup instructions. They are very clear. I will probably have simple questions. Is this where I can ask them?
1. I just installed XAMPP under WinXP. I has PHP 5.2.9. What xdebug should I get?
[Xdebug 2.0.4 Windows binaries:
5.2 VC6 Non-thread-safe, 5.2 VC6,
5.3 VC6 Non-thread-safe, 5.3 VC6,
5.3 VC9Non-thread-safe, 5.3 VC9]
2. I also have a C project I want to do with Eclipse CDT. Can I put the CDT plugin into the Eclipse PDT, or should I have 2 separate Eclipses?
Thanks.
I’ve decided to have Eclipse CDT as a separate installation.
I still confused as to which XDebug to get.
So detailed guide!
Whatever Run->Debug or F11 or click the bug icon in toolbar, I got “The selection cannot be launched, and there are no recent launches”.
So I could not do “8 – a. – i – i”
“1. Run->Open Debug Dialog.”
Do you have ideas?
[…] How To Setup a Free PHP Debugger using Eclipse PDT + XDebug is for Windows users but has very detailed instructions on setting up the Eclipse environment once Apache and PDT are up and running (via the PDT Wiki) […]
I had a real problem just trying to see the Xdebug extension loaded in the phpinfo page. I’m running WAMP – eventually got it but had to change the line in the php.ini file to:
zend_extension=
So, remove the “_ts” from the zend_extension_ts parameter.
P.S. Good article.
[…] How To Setup a Free PHP Debugger using Eclipse PDT + XDebug -Setup a Free PHP Debugger using Eclipse […]
Very nice post!
I have experienced with the port 9000 conflict.
So if you have check point vpn client, this 9000 is occupied, please configure another port for XDebug, like 9090
[…] This article pretty much sums it up very very well. […]
“You can select Xdebug at three different levels: Workspace configuration, Project level configuration and (this one took me half a day) runlevel configuration under RUn -> Run Configurations. Until I had set it to Xdebug there (default was Zend, that’s why it kept listening on port 10000, sigh…) it wouldn’t work”
Thanks Nils, this was driving me BONKERS! All working as expected now.
Please can someone help a me, I don’t know what I’m doing wrong. Step 4(e) Checking for the Xdebug install in phpinfo is not showing up.
[XDebug]
;; Only Zend OR (!) XDebug
; zend_extension_ts=”C:\wamp\bin\php\php5.3.0\ext\”
; Modify the filename below to reflect the .dll version of your xdebug
zend_extension_ts=”C:\wamp\bin\php\php5.3.0\ext\php_xdebug-2.0.5-5.3-vc9.dll”
xdebug.remote_enable=true
xdebug.remote_host=127.0.0.1 ; if debugging on remote server,
; put client IP here
xdebug.remote_port=9000
xdebug.remote_handler=dbgp
xdebug.profiler_enable=0
xdebug.profiler_output_dir=C:\wamp\tmp
My paths are right to the dll. I have tried every dll for my version of php which is 5.3, restarting sevices in wamp each time. I just can’t get XDebug to show in the phpinfo.
Thanks very much for the info. I was struggling to get XDebug to work properly. I am running Eclipse on a workstation connecting to a remote Apoache server with XDebug. If you didn’t specify that xdebug.remote_host needs to be the client PC I would have struggled longer. I couldn’t find any clear instructions regarding this elsewhere.
Anyway… thanks!
[…] How To Setup a Free PHP Debugger using Eclipse PDT + XDebug […]
This is an extremely helpful article! Thanks a lot for sharing it with us. I could have saved a couple of hours if I saw this one earlier.
Thanks SO VERY MUCH. Even with later versions of all apps and Vista – I was able to get XDebug working. Much appreciated!
Thank you Rob! This tutorial was useful to setup XAMPP 1.72 + (Eclipse Classic 3.6 + PDT plugin) + Xdebug on Windows XP. Seem all work fine. My Eclipse has some little differences in menus and forms, but I was able to proceede and let the things working. Also I learned more about how those stuff works and this is good.
Hi,
I am trying to run Xdebug (php_xdebug-2.1.0RC1-5.3-vc6.dll)with Eclipse 20100218-1602. Windows XP SP3, XAMPP 1.7.3.
I see in phpinfo that XDebug is configured properly.
But when I start a debug session from Eclipse, I see “Waiting for XDebug session …” and it is stuck on 57% ..
in never actually gets into debugging session (it does not stop on the first line).
If I press the stop button on the debugger perspective, then I see “Debugging session Ended” message in the browser .
Does any one have any idea?
@SBG – I see the same thing. Walked through all of the steps several times, all seems to be good, but I never get into debug either.
It was quick and easy guide, thank you very much!!
I found that the information of breakpoint that should be caught by xdebugger is caught by the error control windows.The caught information is as follows:
Proxy: someone tries to connect
That is really strange!
I am new to php.downloaded eclipse pdt all requirement.debuginb weberp project. debuging ok upto weberp logon screen. but it is termanting automaticaly. Means not waiting for logon credential. if somebody have weberp then it is terminating after exit command. php script is as below.
if (!isset($_POST[‘UserNameEntryField’]) or $_POST[‘UserNameEntryField’] == ”) {
include($PathPrefix . ‘includes/Login.php’);
exit;
}
@SBG and @Steve
Same problem here, did you find any solution?
thanks,
cirpo
Hey,
I’ve recently gotten a brand new machine and had to do a full build from the ground up. I’m a WAMP user so I built that just fine, then rebuilt it, then buit Xampp instead, then built the zend server CE. Nothing was giving me what I wanted for a debug until I got to this page and rebuilt WAMP with your config directives from the first code sample. Finally this worked.
I don’t think I would have ever gotten there without your code. Cheers, thanks for the great share!
@SBG, @Steve, and @cirpo, This was exactly the problem I was having and the solution seems to have been those config lines from the first code sample. If you haven’t already gotten those lines in and configured to your install, I’d recommend doing so. If you have, then I’m not sure what else to recommend.
Regarding the “stuck at 57%” problem when remote debuging:
I changed a few things at the same time and one of them fixed it. I think it was the adding of this line in my PHP.INI file:
xdebug.remote_autostart=off
This forum post gave me the hint: http://stackoverflow.com/questions/1868568/xdebug-configuration-with-php-fastcgi-and-eclipse
I don’t think it was a port/firewall problem as reported elsewhere.
James
Woww… this is great tutorial yo gave me 🙂
Nice to see this post…
Thank you so much – this solved the “Waiting for XDebug session” problem. Just make sure that 1) xdebug is installed 2) you found the correct php.ini (use phpinfo() to find out) 3) you edit it according to this document 4) you restart apache 5) you correctly configure your eclipse to use xdebug and not zend
Thanks again
I would ask why not configure Xdebug ip proxy (if it is not localhost) and port inside Eclipse and run the site entry script with [Debug as > PHP Web Page]?
“…But when I start a debug session from Eclipse, I see “Waiting for XDebug session …” and it is stuck on 57% .. “.
I had the same problem (I am new to php). The cause was that my php sources were located in my Eclipse project dir instead of a dir in the Apache server root (htdocs)!
[…] PDT?????Debug,??How To Setup a Free PHP Debugger using Eclipse PDT + XDebug ???,???PHP Servers?Path Mapping?,Path on […]
Thanks for the great tutorial! Kudos.
Informationsquellen…
Informationen wurden unter anderem von folgenden Quellen bezogen:…
Thanks Rob!
Even after a few years it works with a little adjustment. I just come back to PHP after a six years break and try to set up the environment. This post was a big step forward.
Hey people,
Just another solution to xdebug not stopping at breakpoints issue:
Make sure that you use “localhost” instead of 127.0.0.1 in your php.ini file. And use the same when accessing the webpage you are debugging
XAMPP 1.7.4, notepad++, xdebug 2.1.0
Thanks for this. This post helped me put an end to multiple days of pulling hair out trying to get breakpoints to work.
With little changes I have made it work. I use php-5.2.10, mysql-5.5.12, apache-2.2.19, Eclipse PDT 2.2.0
Nice tutorial 😉 Thank you
Thanks Rob! I was stuck exactly on the remote_host setting as you helpfully bolded! I’ve gotten my debugger working thanks to you!
Here is the link to one more good free PHP IDE with special plug-in for Drupal:
http://www.youtube.com/watch?v=M90UjD2ffUk
sir i wan a one clear answer how to debug a php with macromedia tools
Rob, your article here was an absolute Godsend. Even so, I had additional problems which I overcame and will detail here.
I’m running Eclipse 3.02 in Win7 with PHP Development Tools (PDT) 3.0.0.201110271513, connecting to Apache 2 / PHP 5.3.3-7 running on Debian under VMWARE Player 4 hosted locally.
My php.ini file is located at /etc/php5/apache2/php.ini and I finally ended up with the configuration as follows:
zend_extension= /usr/lib/php5/20090626+lfs/xdebug.so
xdebug.remote_enable=1
xdebug.remote_host=169.254.205.246
xdebug.remote_port=9000
xdebug.remote_handler=”dbgp”
xdebug.profiler_enable=1
xdebug.profiler_output_dir=”/tmp/xdebug”
xdebug.remote_autostart=1
Now the thing that really tripped me up was that remote host ip address. It was NOT the IP address of my Win7 machine as it saw it. Using NAT with VMWare, two network devices are generated – VMNet1 and VMNet8. The IP address of the first one is the one I needed to use. The 2nd device is used for NAT – possibly I could route through here but no need.
I found the IP addresses of the VMNet1 device on the HOST (Win7) by typing “ipconfig” at the command prompt. In my case 169.254.205.246.
I was able to “prove” I was looking at the right thing by typing “telnet 169.254.205.246 9000” on the GUEST (Debian) O/S. Further (this may not have been required) I also opened up the firewall to PORT 9000 on Win7 for any incoming connections on the PRIVATE network (ie only local traffic).
Another thing that I had to understand was that the PORT 9000 is used by the Webserver to connect back to the client, not the other way around. So instead of checking for listening ports on the GUEST (Debian) O/S, I had to check it on the HOST Win7 box ie Eclipse was the thing doing the listening. To do this I typed
netstat -ano |find /i “listening”|find “9000”
At the Win7 command prompt. Which showed me the Eclipse process id was happily listening away. Hope that helps out anyone trying the same thing.
Thanks again – I could not have done it without you!
Peter
[…] die, obwohl etwas veraltet, bei der Einrichtung und Benutzung des Debuggers hilft, findet man hier. Da ich weiter die bestehenden CSS und Javascript Programmabschnitte verändern muss, benötigte […]
Short of god’s gift to eternal salvation, this tutorial is the greatest gift I’ve received. Here are some updates in the year 2012:
4e: If this all still doesn’t work, make sure the dll is the right size ~145kb. I downloaded one that was 3kb and the computer didn’t complain. It just didnt’ work
7g: There was no Windows->Web browser in
Version: Helios Release
Build id: 20100617-1415
There’s Windows->Show View->Other->General->Internal Web Browser which is available only after ie is open
8a(i)i The proper sequence is now Run->Debug Configurations->PHP Web Page->New_configuration etc. when you make a new configuration.
The computer still insists on adding the project name to the url, so auto-generate will not work.
CAN’T GET XDEBUG TO HALT ON BREAKPOINTS. Great tutorial, which I have been studying all day. I want to create a debugging workstation with NetBeans on a WinXP machine (with local IP address 192.168.0.42). Also on our local LAN I have a CentOS 5.8 server which hosts a “development” website on which I want to test changes and updates (hopefully with the aid of NetBeans) before I deploy them to our production webserver which is hosted elsewhere. The IP of the local development CentOS server is 192.168.0.96. I have installed xdebug on the CentOS server and configured its php.ini file with “xdebug.remote_host=192.168.0.42”. I then created a new “PHP Application from Remote Server” project in NetBeans, pointing to the CentOS server. When I start a debug session in NetBeans, it launches an IE browser with the tag “XDEBUG_SESSION_START=netbeans-xdebug” and when I stop the debug session a related STOP command issues forth, stopping the debug process. All of this suggests that xdebug is working and that NetBeans is communicating with the CentOS server. However, when I set breakpoints in the index.php of the starting page (or any other php file), NetBeans ignores them and does not halt the program. Something is apparently misconfigured but darned if I can determine what it is. (By the way, if I create a test website on the NetBeans XP machine with WAMP and create a NetBeans project from that local web source, breakpoints and single-stepping work fine.) Any suggestions for where I am going wrong? Thanks for what you do Rob.
If Netweaver/Eclipse fails to connect to XDebug, you may wish to check the Apache logs for occurrences of something like: Cannot load Xdebug – it was built with configuration API220090626,TS,VC6, whereas running engine is API220090626,TS,VC9
[Fri Jun 01 18:38:05 2012] [notice] Child 3404: Child process is running
To remedy this, pick the right version of the XDebug binary from the XDebug website (try a few combinations till you get it working)
Not worked for me. But after applying recommendation from
“John J Smithon 05 Aug 2009 at 6:05 am” works great.
thanks a lot for this article!
concerning XDEBUG GETTING STUCK ON 57%
PLEASE TRY TO LAUNCH A DIFFERENT FILE AND READ THIS!
http://dwaver.wordpress.com/2012/07/10/setup-a-php-development-environment-with-debian-in-5min-lighttpd-xdebug-php5-eclipse-pdt-vnc/
thanks dear……facing problem with xdebug get resolved by reading ur post….
thanks
[…] https://robsnotebook.com/php_debugger_pdt_xdebug […]
[…] How To Setup a Free PHP Debugger using Eclipse PDT + XDebug. This entry was posted in Uncategorized. Bookmark the permalink. ← NYS Division of Licensing Services […]
[…] Setting up to debug https://robsnotebook.com/php_debugger_pdt_xdebug […]